1. Choose the right tool
The platform has two main public applications. The Hazard Library answers “which documents or media exist?” Risk Explorer answers “what does the available flood-risk evidence show for a place?”
flowchart LR
  A[What do you need?] -->|Documents, maps, studies, news| L[WV Hazard Library]
  A -->|Risk conditions for a place| R[WV Risk Explorer]
  R --> M[Interactive Risk Maps]
  R --> P[Printable Risk Reports]
  R --> D[Dashboards and Visualizations]
  R --> B[BL Risk and other tools]
  L --> X[Open source item or export CSV]
  M --> S[Explore layers and share map]
  P --> C[Compare indicators and export CSV]
Text alternative: use the Library for source material; use Risk Explorer for maps, place reports, dashboards, visualizations, and building-level tools.
You know a topic, publication year, author, event, geographic place, or media type and want source material.
You want spatial patterns, indicator values, a community report, a dashboard, or building-level risk information.
2. WV Hazard Library
The Library searches the FloodRisk resource catalog. Standard search exposes the most common filters; Advanced search adds meetings, projects, stakeholders, findings level, and special-resource flags.
flowchart TD
  O[Open Hazard Library] --> V{Standard or Advanced?}
  V -->|Standard| F[Choose keywords, subject, place, year, media or author]
  V -->|Advanced| A[Add meeting, project, stakeholder and special flags]
  F --> Q[Search]
  A --> Q
  Q --> T[Review matching count and sortable results]
  T --> I[Open More Info]
  T --> E[Export CSV]
  T --> U[Copy full or short query URL]
Text alternative: choose Standard or Advanced filters, search, then inspect, export, or share the matching records.
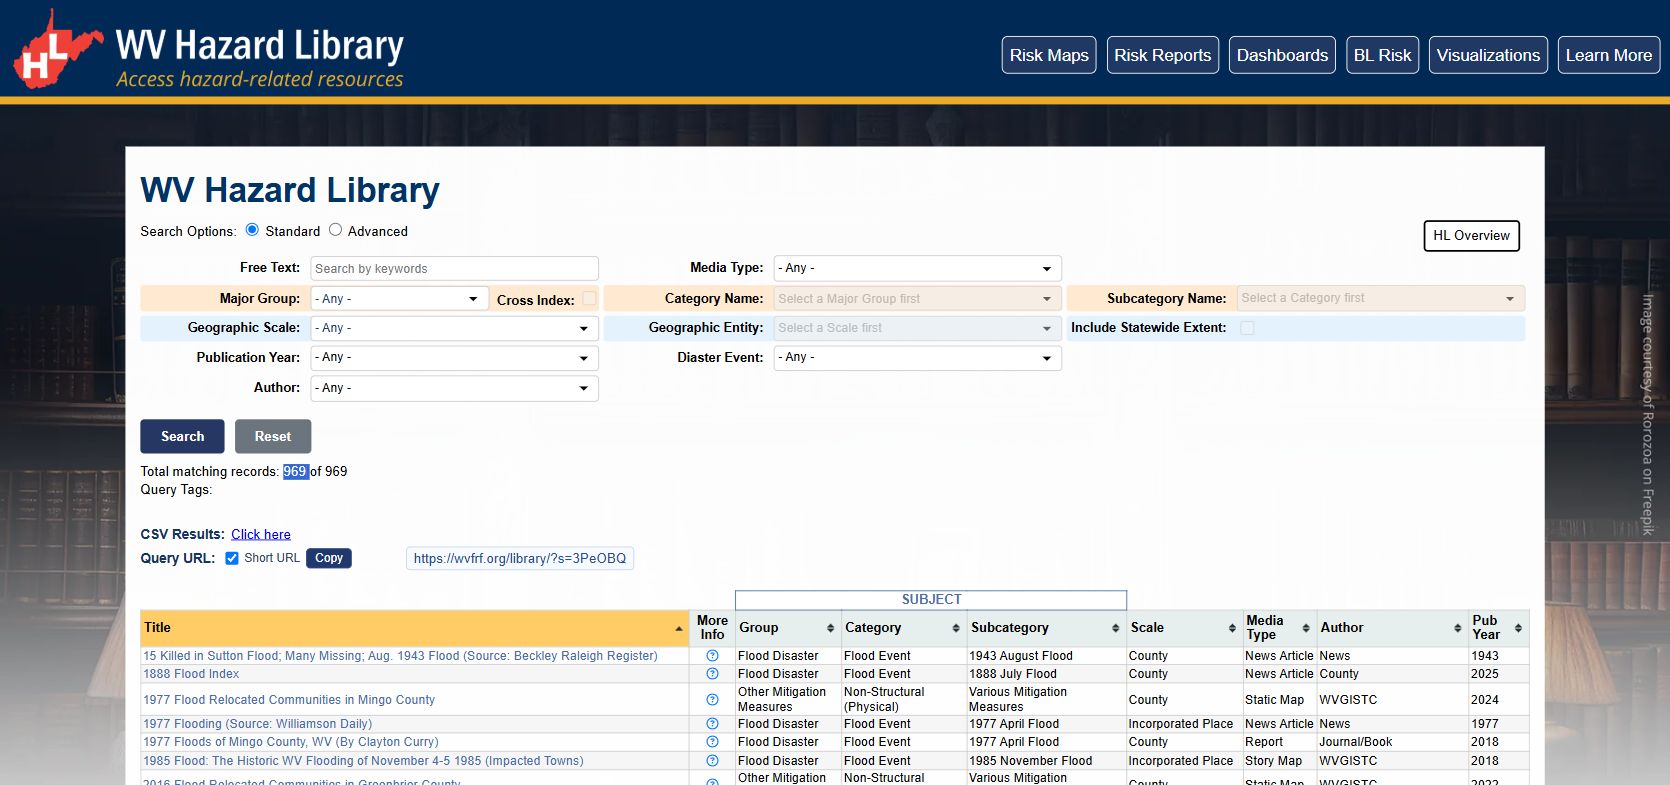
How filters behave
- Filters from different families are combined, so adding filters normally narrows the result set.
- Multiple choices within one filter are treated as alternatives.
- Category and subcategory choices depend on the selected parent subject.
- Geographic Entity depends on Geographic Scale.
- Include Statewide Extent adds statewide materials only when a geographic entity is part of the search.
- Flood Visualizations and Key Materials add designated records; these additions may not match every other selected filter.
- Cross Index also finds records connected through cross-indexed subject groups.
3. WV Risk Explorer
Risk Explorer is the launch point for maps, reports, dashboards, the Hazard Library, building-level tools, visualizations, data access, landslide information, and benefit resources.
Use Risk Maps for interactive geographic exploration.
Use Risk Reports for a structured, printable place profile.
Use dashboards, BL Risk, Visualizations, and Access Data for specialized questions.
4. Risk Maps
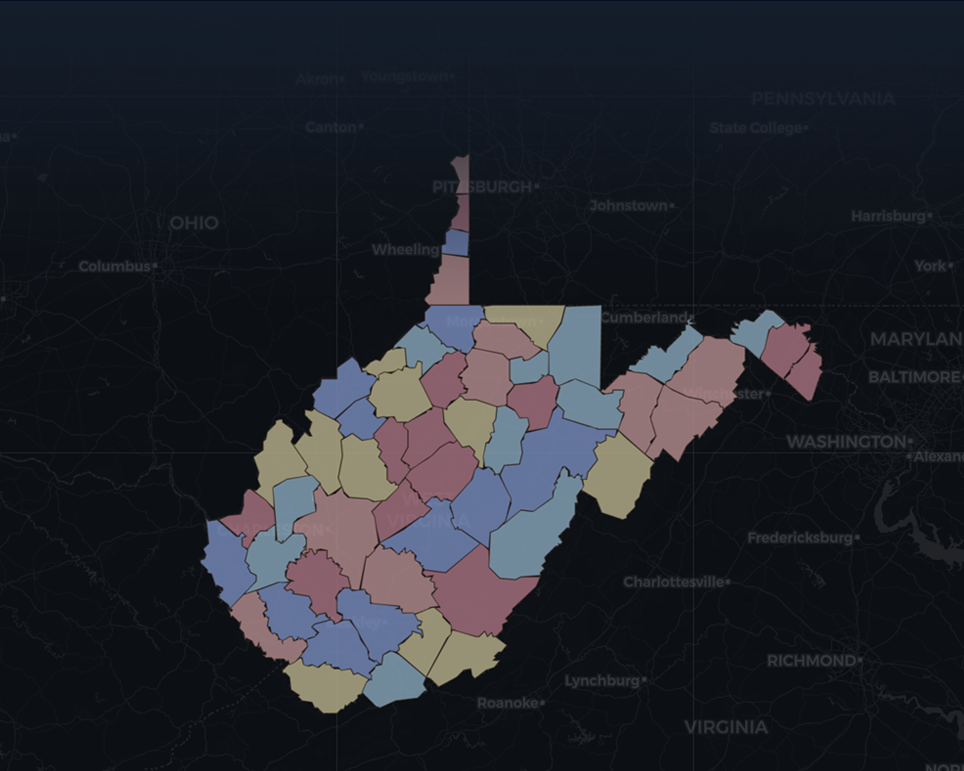
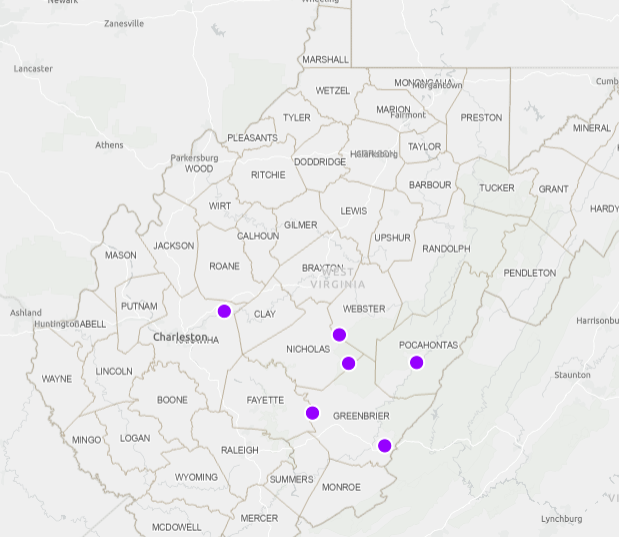
Risk Maps combine geographic boundaries, risk-factor values, and ArcGIS map services. Start by choosing a geographic scale and place, then choose the risk factor or category you want to display.
- Select a scale such as county or community.
- Select a geographic entity or click an available area on the map.
- Select a risk factor; read the legend before comparing colors.
- Use pop-ups and supporting controls to inspect values and context.
- Copy the map URL when you need to preserve the current state.
5. Understand risk scores
Risk Explorer combines configured flood-exposure, vulnerability, and contextual indicators. Many displayed rank values are relative: they show where a place falls among other places in the same geographic-scale comparison group.
flowchart LR
  S[Source measurements] --> I[Configured indicators]
  I --> R[Percentile ranks within one scale]
  R --> C[Seven category summaries]
  C --> A[Combined category score]
  A --> P[Cumulative Risk Index percentile]
Text alternative: source measurements are transformed into configured indicators, ranked against places at the same scale, summarized into seven categories, and ranked again to form the Cumulative Risk Index.
The place ranks above more members of the applicable comparison group for the configured score. The comparison group changes with geographic scale.
An 80% index is not an 80% chance of flooding, an 80% loss estimate, or proof that every location inside the boundary has the same risk.
- Compare places only when they use the same scale, indicator definition, unit, and data release.
- Use raw values and source metadata alongside ranks; rank alone does not show the size of the underlying difference.
- Tied and missing values can affect rank interpretation.
- Use authoritative engineering, regulatory, emergency-management, and insurance sources for site-specific decisions.
6. Risk Reports
sequenceDiagram
  actor User
  participant Form as Report selector
  participant Report as Report page
  participant Export as Print / CSV
  User->>Form: Choose scale and place
  Form->>Report: Load organized risk content
  Report-->>User: Sections, values, context and map
  User->>Export: Print page or request CSV
  Export-->>User: Shareable output
Text alternative: choose a scale and place, review the organized report, then print it or export its configured data.
Risk Reports organize available indicators into a consistent place-based summary. Select one place for a normal report. A hierarchy export is a separate operation intended for correctly formed parent/child geographic requests.
- Use the on-page headings to move between risk themes.
- Read definitions and units; indicators are not directly comparable unless their scales match.
- Use the browser print command for a printable/PDF version.
- Use CSV when you need the underlying configured report fields.
7. Dashboards and supporting tools
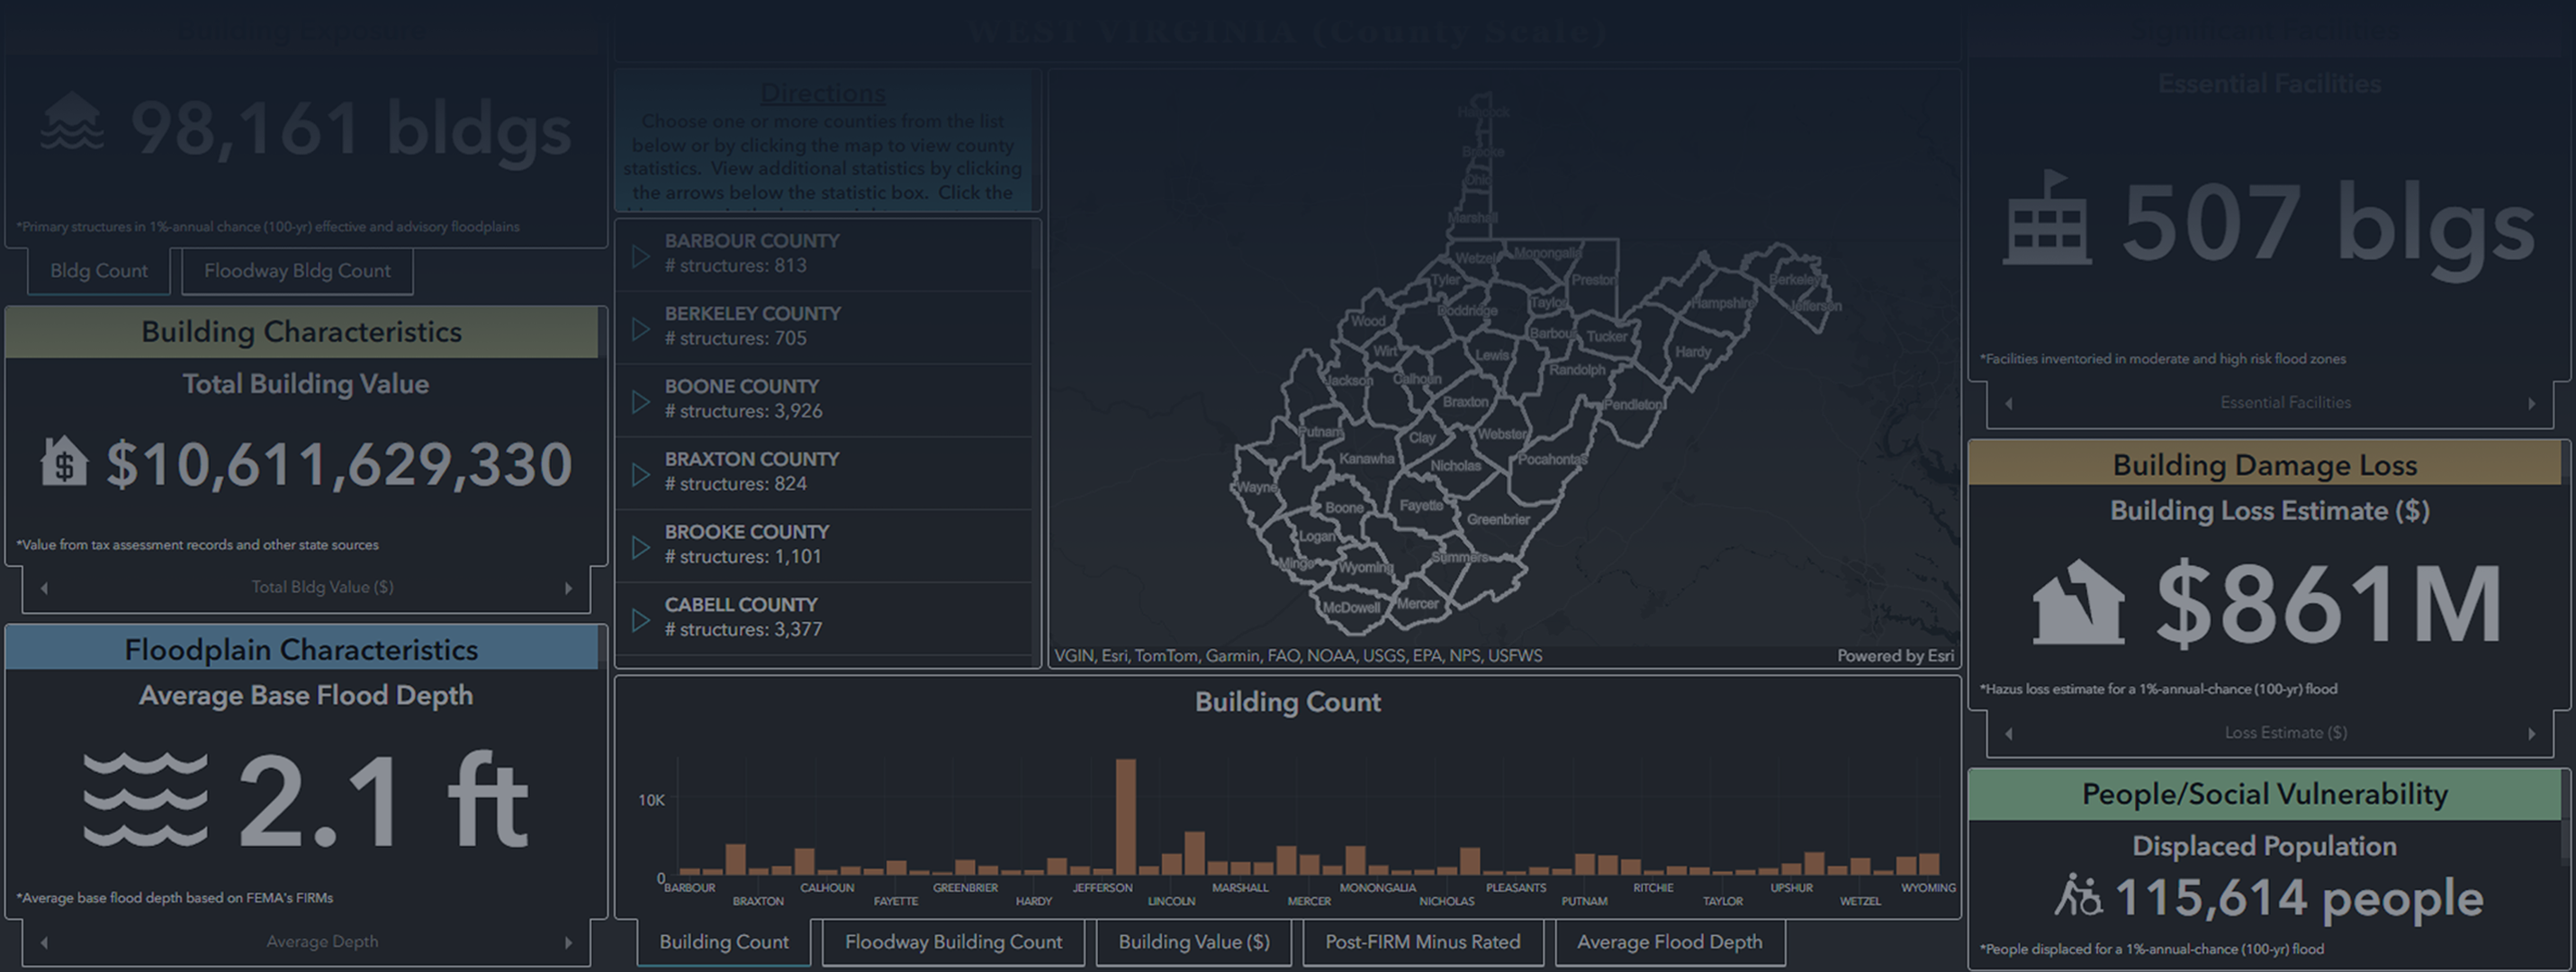
| Tool | Best used for | Remember |
|---|---|---|
| Dashboards | Interactive summaries and charts hosted in approved ArcGIS applications. | Some panels may load more slowly than the surrounding page. |
| BL Risk / BLRA | Building-level risk assessment and related public workflows. | Owner-restricted information is not part of the public guide. |
| Visualizations | Focused visual explanations of risk topics. | Check the visualization source and date. |
| Access Data | Finding downloadable or connected datasets. | Review licensing, metadata, scale, and update date. |
| Landslide | Landslide-related information and tools. | It is a supporting hazard surface, separate from FloodRisk report calculations. |
| Benefits | Mitigation-benefit resources and supporting context. | Inputs and assumptions determine the meaning of results. |
9. Troubleshooting and glossary
Common issues
- No results: remove the most specific filter first, then search again.
- Disabled list: choose its parent subject or scale first.
- Count looks stale: wait until catalog maintenance and cache refreshes finish, then reload.
- Dashboard is blank: allow the approved ArcGIS frame and retry on a current browser.
- Shared link differs: copy the URL only after the page finishes applying selections.
Terms
- Resource: a cataloged document, map, dataset, webpage, or media item.
- Scale: geographic level used to organize, compare, or report data.
- Entity: a named geographic unit at a scale.
- Risk factor: a configured indicator used by maps or reports.
- Comparison group: the places against which a relative rank is calculated, normally at the same scale.
- Cumulative Risk Index: the percentile rank of the combined category score within its comparison group.
- Cross-index: an additional subject relationship for a Library resource.
Public applications: WV Hazard Library · WV Risk Explorer